The number of computing degrees awarded to Black, Latina, and Native American (BLNA) women nearly doubled from 2016 to 2021. Yet representation of BLNA women in tech roles has steadily declined by more than 10 percent in the past four years, senior partner Tiffany Burns and coauthors note. Current policies and practices haven’t helped Black, Latina, and Native American women in tech as much as they could, and approximately 40 percent of BLNA women report experiencing prejudice related to gender or race at work, our analysis finds.
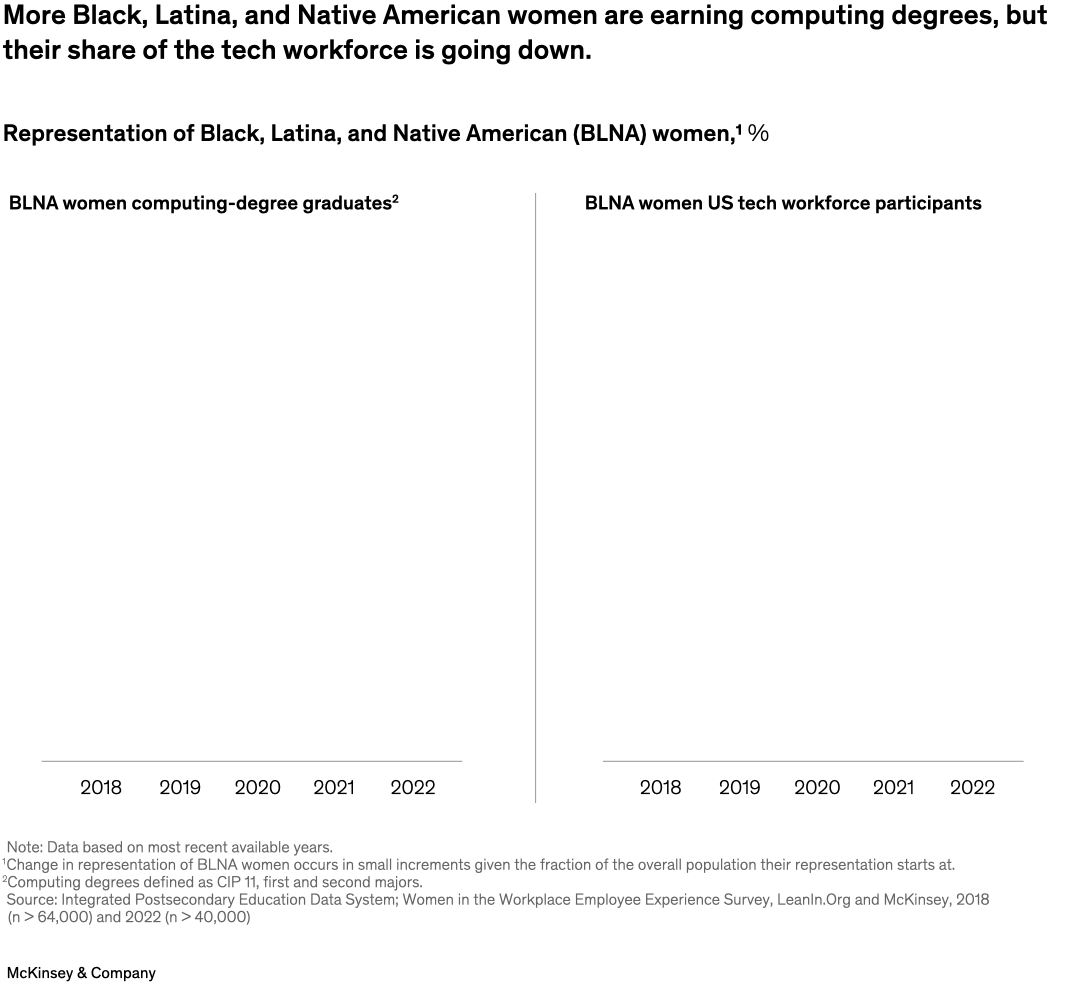
Image description:
A pair of bar graphs display the representation of Black, Latina, and Native American (BLNA) women as a share of the tech workforce. The graph on the left highlights that more BLNA women have become computing-degree graduates, moving from 4.2% of graduates in 2018 to 4.7% in 2021. The second graph shows, however, that the BLNA share of the tech workforce is dropping, during a similar period, going from 4.6% of the workforce in 2018 to 4.1% in 2022.
Note: Data based on most recent available years.
Footnote 1: Change in representation of BLNA women occurs in small increments given the fraction of the overall population their representation starts at. Footnote 2: Computing degrees defined as CIP 11, first and second majors.
Source: Integrated Postsecondary Education Data System; Women in the Workplace Employee Experience Survey, LeanIn.Org and McKinsey, 2018 (n > 64,000) and 2022 (n > 40,000).
End of image description.
To read the report, see “Empowering Black, Latina, and Native American women in tech,” August 29, 2023.