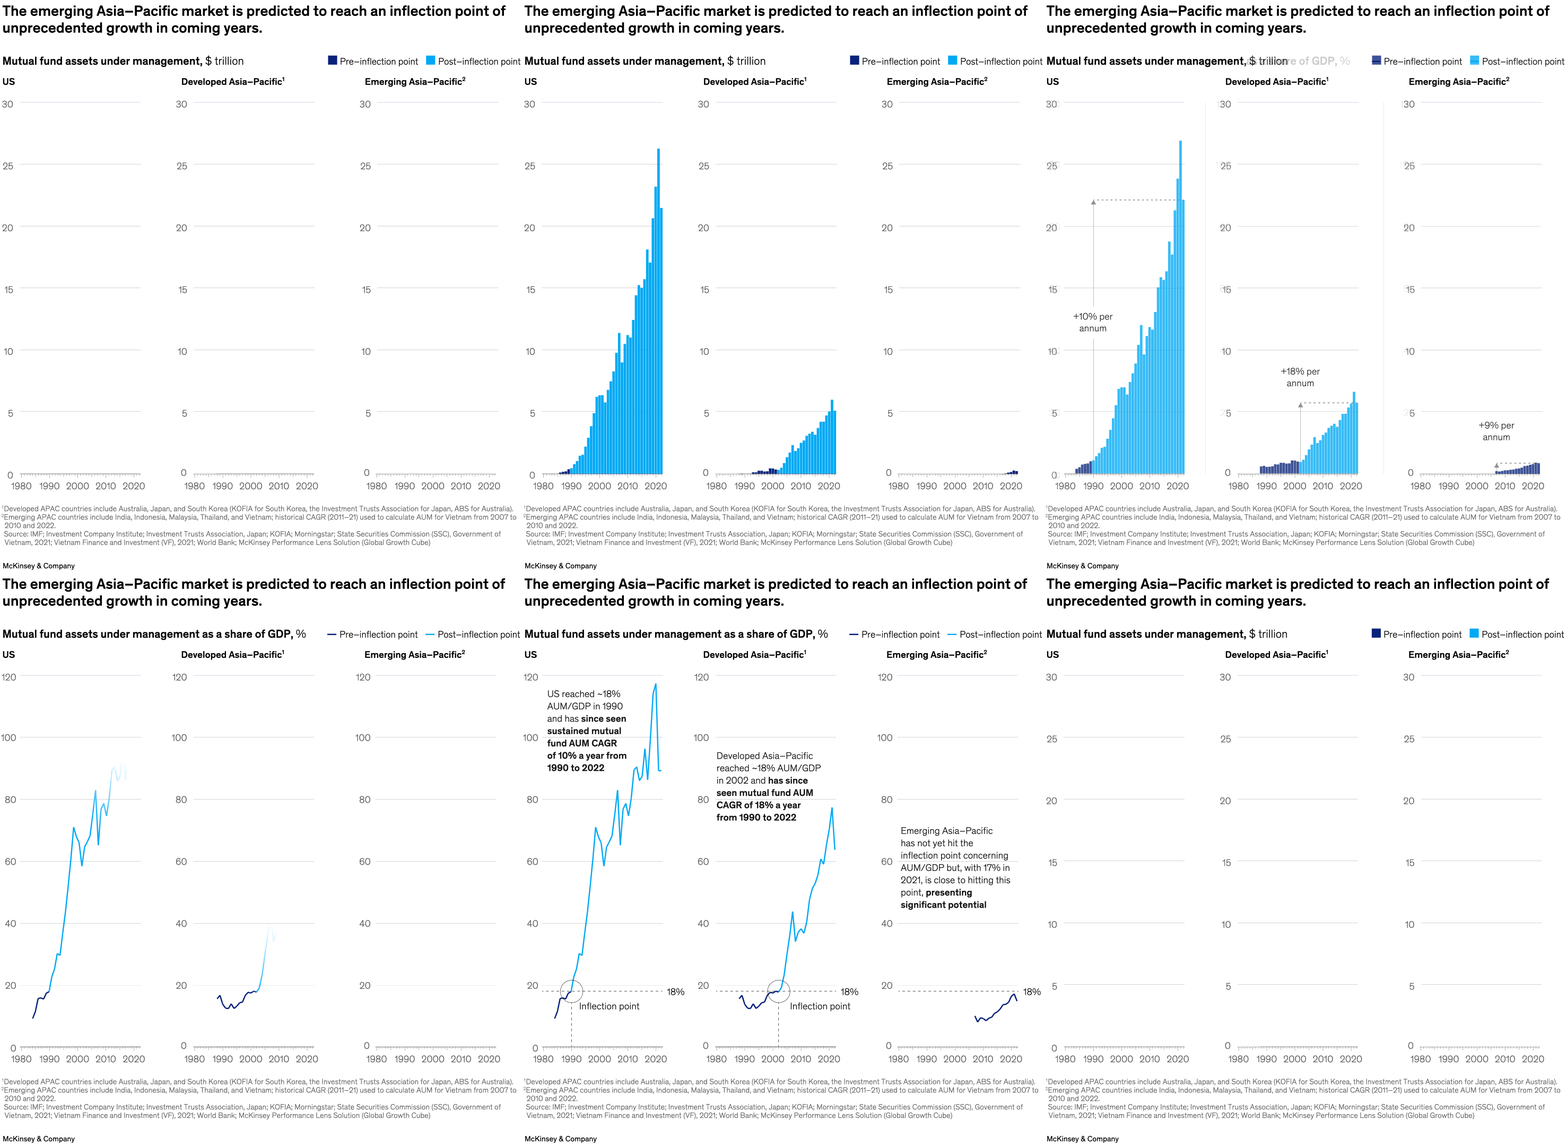
The wealth management industry could be looking at significant opportunities in the Asia–Pacific region, note senior partners Bernhard Kotanko and Joydeep Sengupta and coauthors. In the same way the United States experienced a run of sustained growth in mutual fund assets under management, starting in the 1990s, both developed and emerging countries in the Asia–Pacific market could be on a similar trajectory. A set of technology platforms and tools could help wealth management companies tap the region’s potential upside.

Image description:
A 2-slide animation shows the history of inflection points in mutual fund assets under management (AUM) in the US, developed Asia–Pacific, and emerging Asia–Pacific. The first slide of 3 bar graphs displays total annual assets under management, in trillions of dollars, from 1980 to 2020. The bars show an annual growth rate of 10% per annum since inflection for the US, 18% for developed Asia–Pacific, and 9% for emerging Asia–Pacific. The second slide shows total annual assets under management as a percentage share of GDP from 1980 to 2020. A text overlay for the US graph reads, “US reached ~18% AUM/GDP in 1990 and has since seen sustained mutual fund AUM CAGR of 10% a year from 1990 to 2022”; the developed Asia–Pacific graph text reads, “Developed Asia–Pacific reached ~18% AUM/GDP in 2002 and has since seen mutual fund AUM CAGR of 18% a year from 1990 to 2022”; and the emerging Asia–Pacific text reads, “Emerging Asia–Pacific has not yet hit the inflection point concerning AUM/GDP but, with 17% in 2021, is close to hitting this point, presenting significant potential.”
Footnote 1: Developed APAC countries include Australia, Japan, and South Korea (KOFIA for South Korea, the Investment Trusts Association for Japan, ABS for Australia).
Footnote 2: Emerging APAC countries include India, Indonesia, Malaysia, Thailand, and Vietnam; historical CAGR (2011–21) used to calculate AUM for Vietnam from 2007 to 2010 and 2022.
Source: IMF; Investment Company Institute; Investment Trusts Association, Japan; KOFIA; Morningstar; State Securities Commission (SSC), Government of Vietnam, 2021; Vietnam Finance and Investment (VF), 2021; World Bank; McKinsey Performance Lens Solution (Global Growth Cube).
End of image description.
To read the article, see “WealthTech in Asia–Pacific: The next frontier in financial innovation,” October 18, 2023.