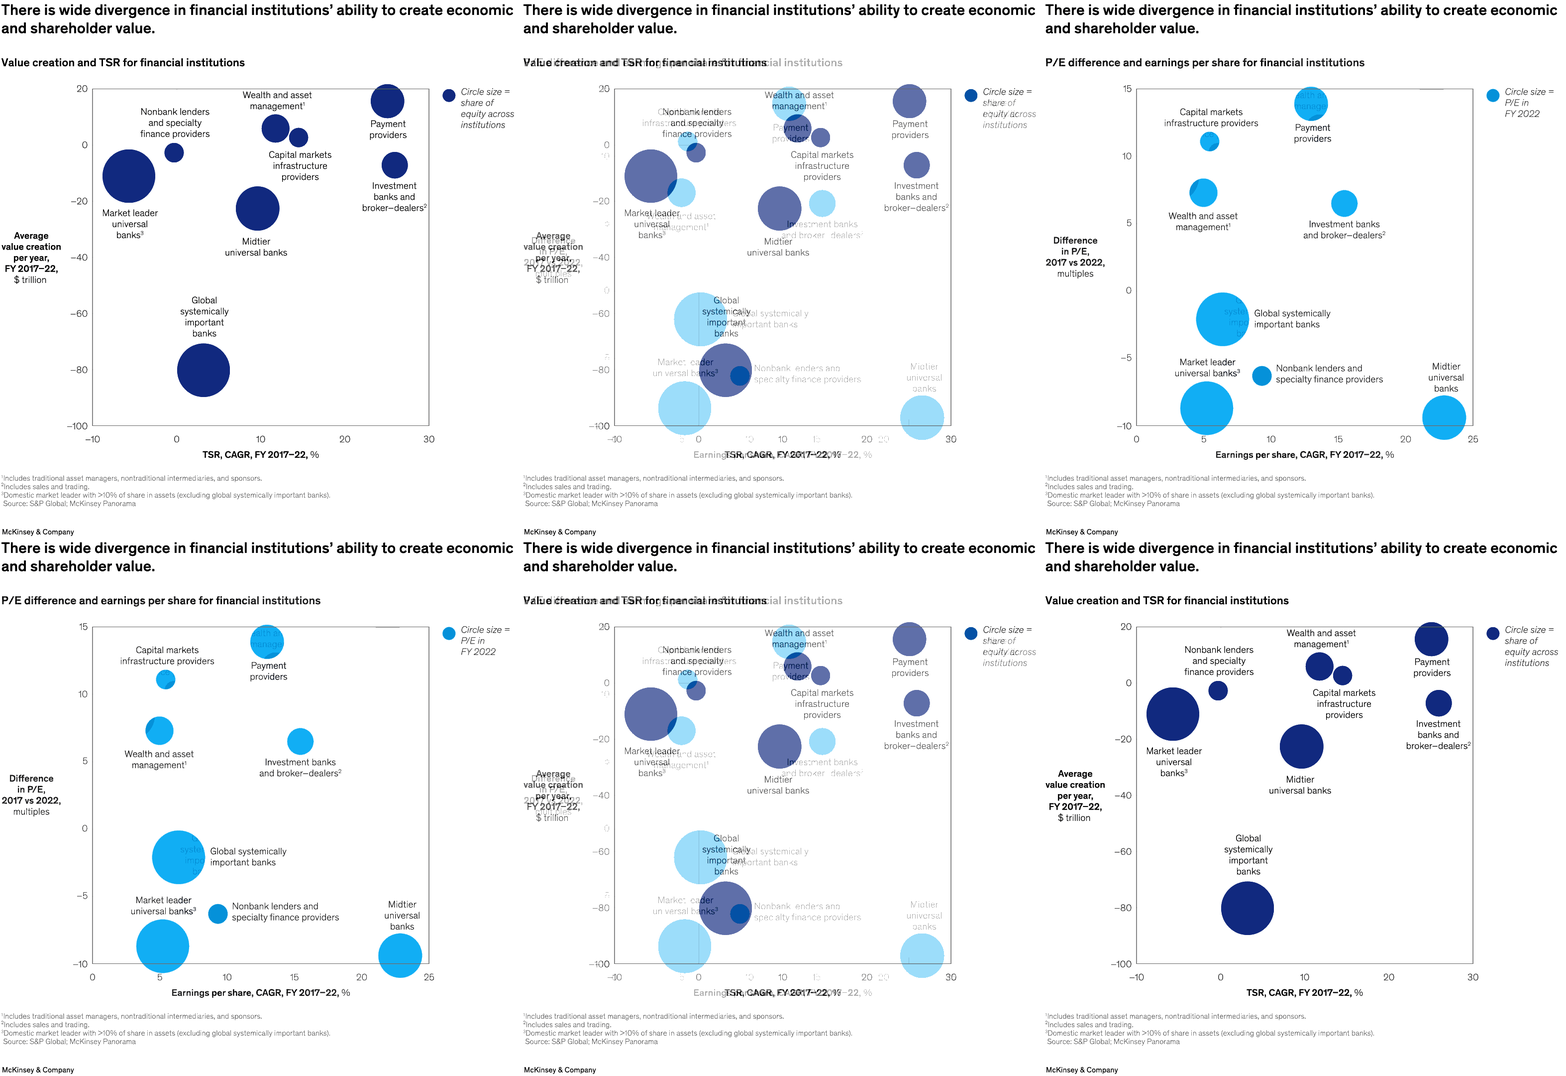
Banking institutions have been on a wild ride in recent years, and their performance has varied depending on the type of institution. For example, according to senior partner Miklós Dietz and coauthors, payment providers, capital market infrastructure providers, and asset managers are among the categories that increased their price to earnings between 2017 and 2022, while other categories, including universal banks and nonbank lenders, saw a decline. Strong performers tend to use the balance sheet effectively, are customer centric, and lead on technology.

Image description:
An animation of 2 scatterplots merging back and forth: one showing financial institutions’ ability to create shareholder value and the other their ability to create economic value. The first scatterplot shows TSR from 2017 to 2022 for different types of financial institutions, wherein the y-axis is the average value creation per year in trillions of dollars and the x-axis is the CAGR for TSR. Dot size corresponds to institutions’ share of equity.
The second scatterplot shows the P/E difference by type of financial institution from 2017 to 2022, wherein the y-axis is the difference per year in multiples and the x-axis is the CAGR for earnings per share. Dot size corresponds to institutions’ P/E ratio in 2022.
Institutions that appear high along both axes in both graphs are the most successful with payment providers. Investment banks and broker–dealers are the top 2 on both.
Source: S&P Global; McKinsey Panorama.
End of image description.
To read the report, see “Global Banking Annual Review 2023: The Great Banking Transition,” October 10, 2023.