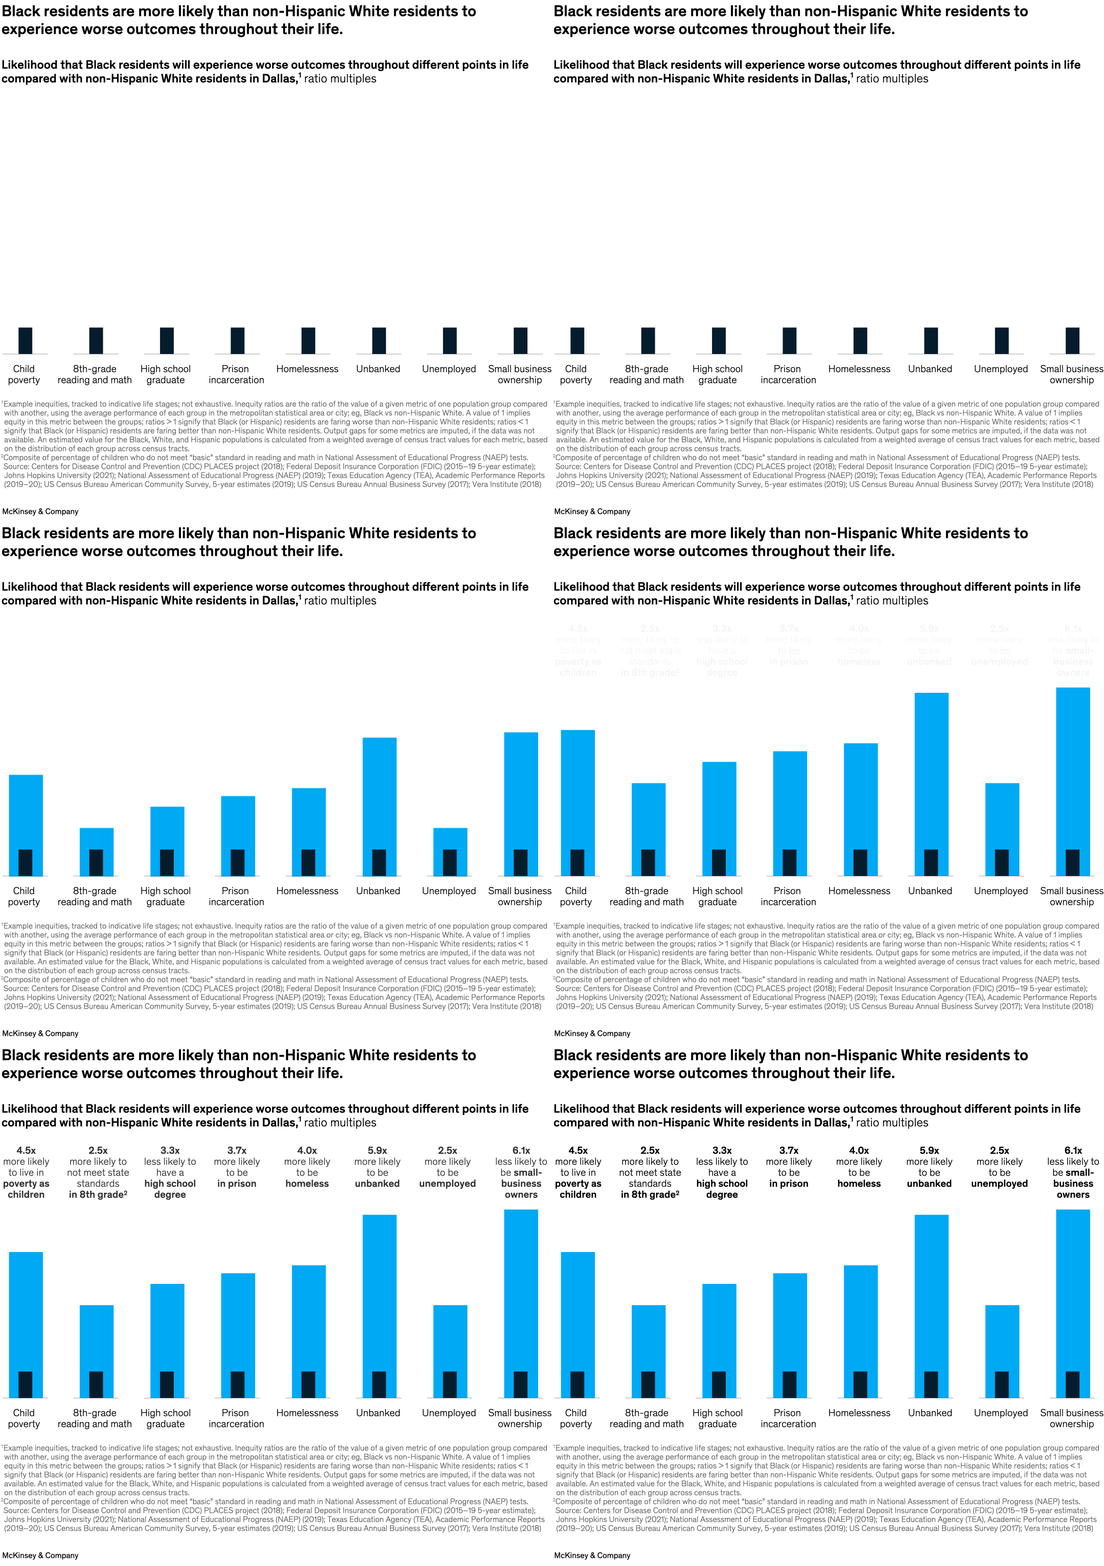
Racial inequality trends are national in scope, but vast differences can exist between states and cities. Senior partners Kweilin Ellingrud and Ramesh Srinivasan and colleagues homed in on neighborhood-level data from eight US cities with large Black and Hispanic populations, finding that, in Dallas, for example, Black children are 4.5 times as likely to live in poverty and are 3.3 times less likely to earn a high school degree than their non-Hispanic White peers.

Image description:
A bar chart displays eight bars, each showing two data points. The bars display data, from the city of Dallas in the US, at various points in life, using the non-Hispanic White population as a baseline and likelihood multiples to show how the Black population fares by comparison. Running from left to right, the bars display that the Black population is, on average, 4.5 times more likely to live in poverty, 2.5 times more likely to not meet state standards in 8th grade, 3.3 times less likely to have a high school degree, 3.7 times more likely to be in prison, 4.0 times more likely to be homeless, 5.9 times more likely to be unbanked, 2.5 times more likely to be unemployed, and 6.1 times less likely to be small-business owners.
Footnote 1: Example inequities, tracked to indicative life stages; not exhaustive. Inequity ratios are the ratio of the value of a given metric of 1 population group compared with another, using the average performance of each group in the metropolitan statistical area or city; eg, Black vs non-Hispanic White. A value of 1 implies equity in this metric between the groups; ratios > 1 signify that Black (or Hispanic) residents are faring worse than non-Hispanic White residents; ratios < 1 signify that Black (or Hispanic) residents are faring better than non-Hispanic White residents. Output gaps for some metrics were imputed if the data were not available. An estimated value for the Black, White, and Hispanic populations is calculated from a weighted average of census tract values for each metric, based on the distribution of each group across census tracts.
Footnote 2: Composite of percentage of children who do not meet “basic” standard in reading and math in National Assessment of Educational Progress (NAEP) tests.
Source: Federal Deposit Insurance Corporation, 2015–19 5-year estimate; Johns Hopkins University, 2021; NAEP, 2019; Texas Education Agency, Academic Performance Reports, 2019–20; US Census Bureau, American Community Survey, 5-year estimates, 2019; US Census Bureau, Annual Business Survey, 2017; US Centers for Disease Control and Prevention, PLACES project, 2018; Vera Institute of Justice, 2018
End of image description.
To read the article, see “Zooming in: Using local insights to inform US racial-equity efforts,” February 27, 2023.