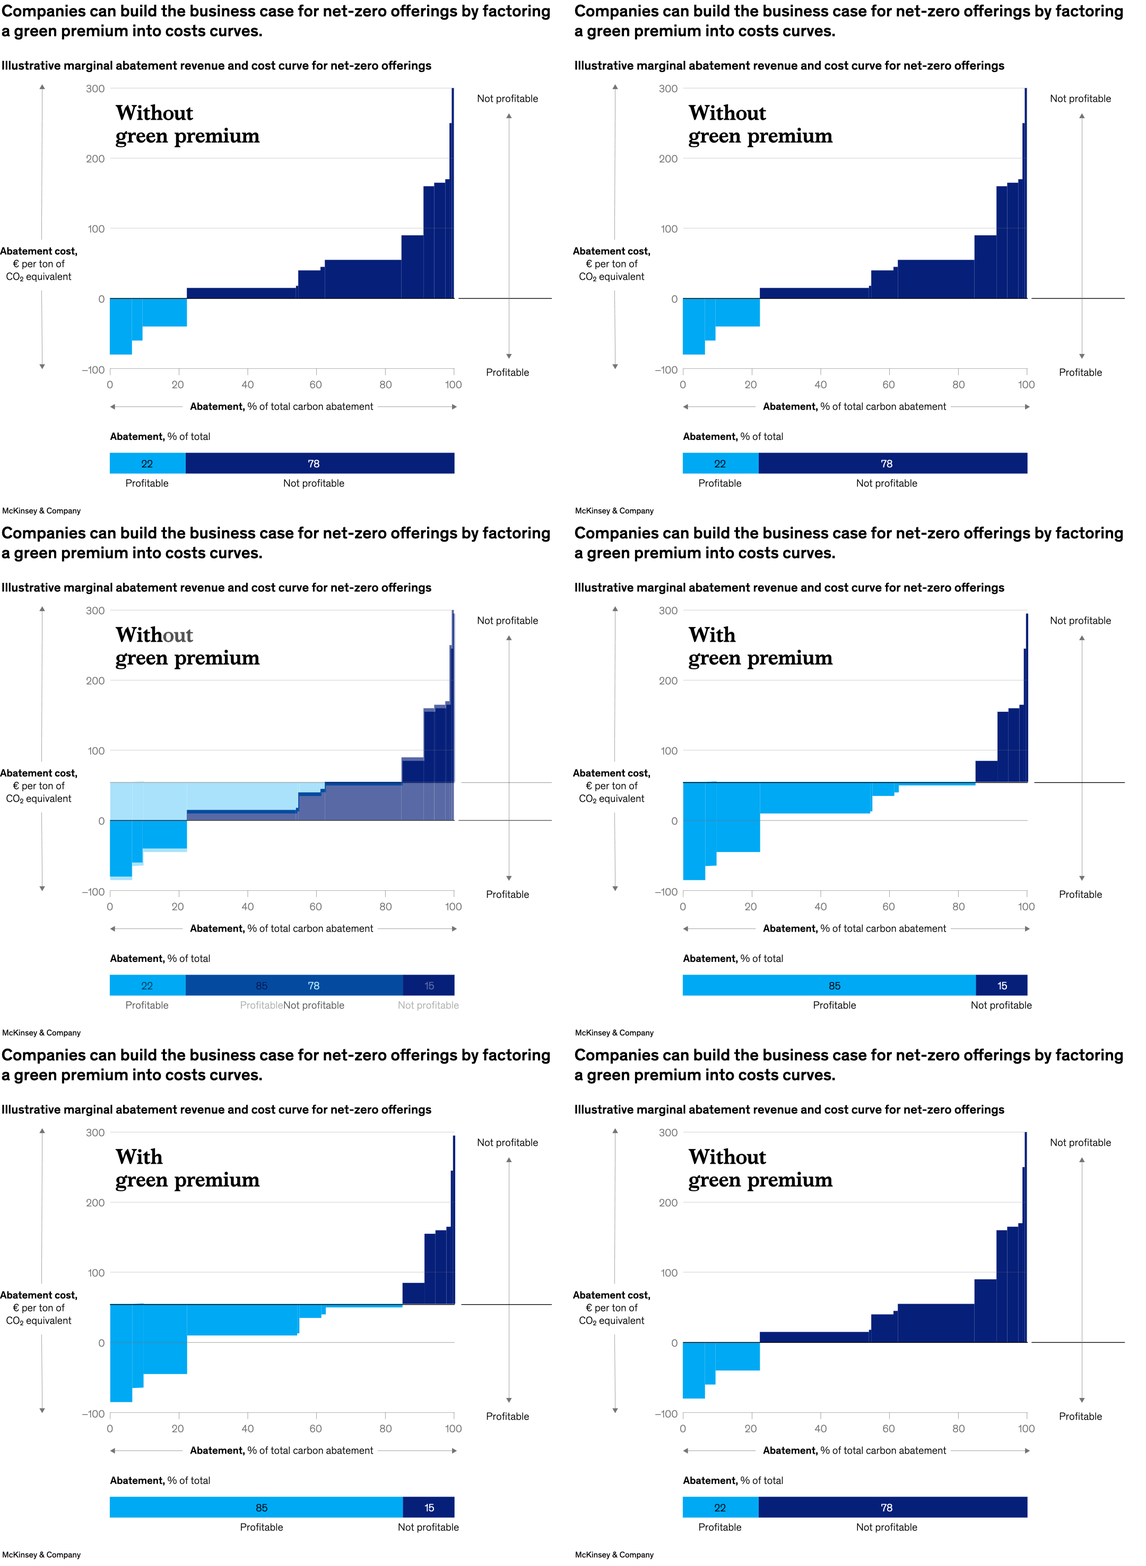
Demand for net-zero offerings continues to surge. However, the costs for launching low-carbon products can run high. According to senior partner Philipp Radtke and coauthors, one way companies can build the business case for net-zero offerings is to include a price premium in cost curves—to reflect the potential revenue upside of in-demand green goods and services.

Image description:
A 2-slide animation of a vertical bar graph shows the illustrative marginal abatement revenue and cost curve for launching net-zero offerings with and without a green premium. The y-axis to the left is the abatement cost in € per ton of CO2 equivalent. The x-axis is the percentage of total carbon abatement. The y-axis to the right indicates decreasing profitability toward the top. On slide 1, without a green premium, the y-axis has a horizontal line at €0 per ton of CO2 equivalent. On slide 2, with a green premium, that line is at €60. The graph starts at €–80 and 0% abatement. Moving left to right, the abatement cost rises to €300 and abatement rises to 100%. On slide 1, the profitability inflection point is at 22%, after which further abatement becomes unprofitable. On slide 2, that point is at 85%. A horizontal bar graph below the vertical graph shows this divide with 2 bars for profitable and not profitable percentages of abatement.
End of image description.
To read the article, see “Decarbonize and create value: How incumbents can tackle the steep challenge,” October 24, 2023.