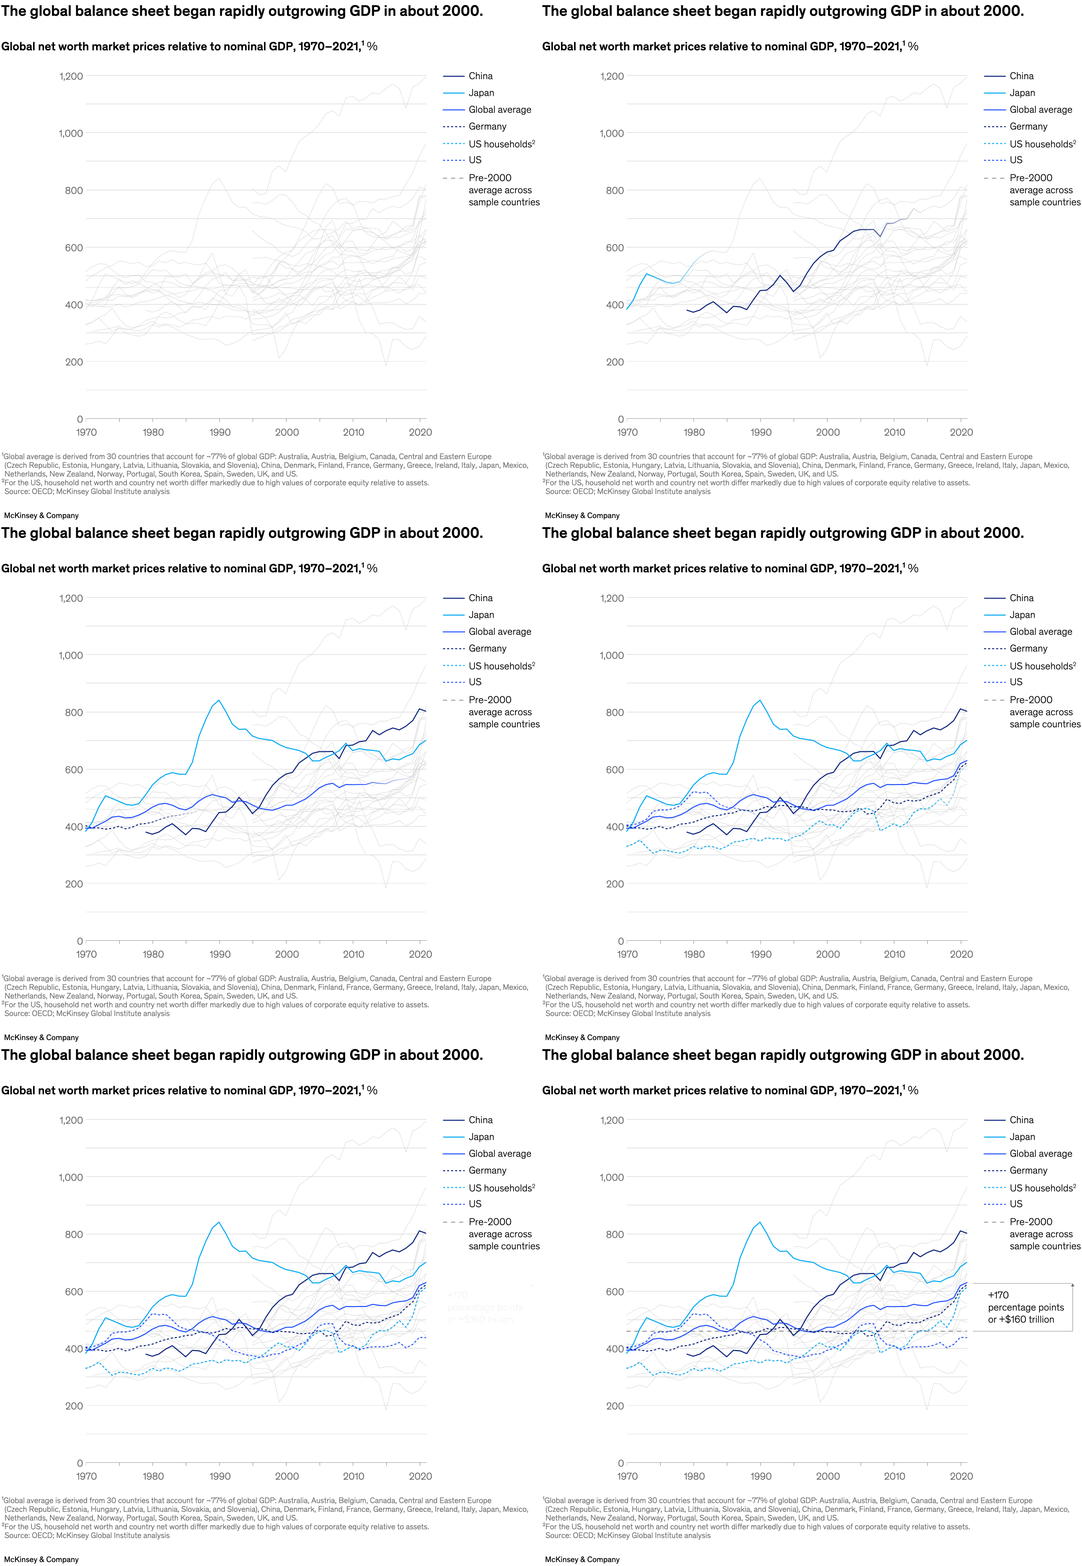
Global economic growth has been sluggish over the past two decades, even as asset price inflation created “paper wealth” of $160 trillion, according to a recent report by the McKinsey Global Institute (MGI). Global net worth for the most part grew with GDP growth until 2000, MGI chair and chair of insights and ecosystems Sven Smit and coauthors note. However, around the turn of the millennium, asset values, net worth, and debt started growing faster than GDP, as G-7 countries saw productivity growth drop from 1.8 percent annually for 1980–2000 to 0.8 percent for 2000–18.

Image description:
A line graph representing nations and demographics shows global net worth market prices relative to nominal GDP, 1970–2021, by percent. Six lines, representing China, Japan, the global average, Germany, US households, and the US overall, are emphasized in color, while the rest are gray. The lines reach their highest and lowest in 2021. The US has remained flat overall out of the group, while China and Japan have increased most of all. A horizontal line shows the pre-2000 average, and a text box shows a +170 percentage-point (or +$160 trillion) change between the pre-2000 average and the global average.
Footnote 1: Global average is derived from 30 countries that account for ~77% of global GDP: Australia, Austria, Belgium, Canada, Central and Eastern Europe (Czech Republic, Estonia, Hungary, Latvia, Lithuania, Slovakia, and Slovenia), China, Denmark, Finland, France, Germany, Greece, Ireland, Italy, Japan, Mexico, Netherlands, New Zealand, Norway, Portugal, South Korea, Spain, Sweden, UK, and US.
Footnote 2: For the US, household net worth and country net worth differ markedly due to high values of corporate equity relative to assets.
Source: OECD; McKinsey Global Institute analysis.
End of image description.
To read the report, see “The future of wealth and growth hangs in the balance,” May 24, 2023.