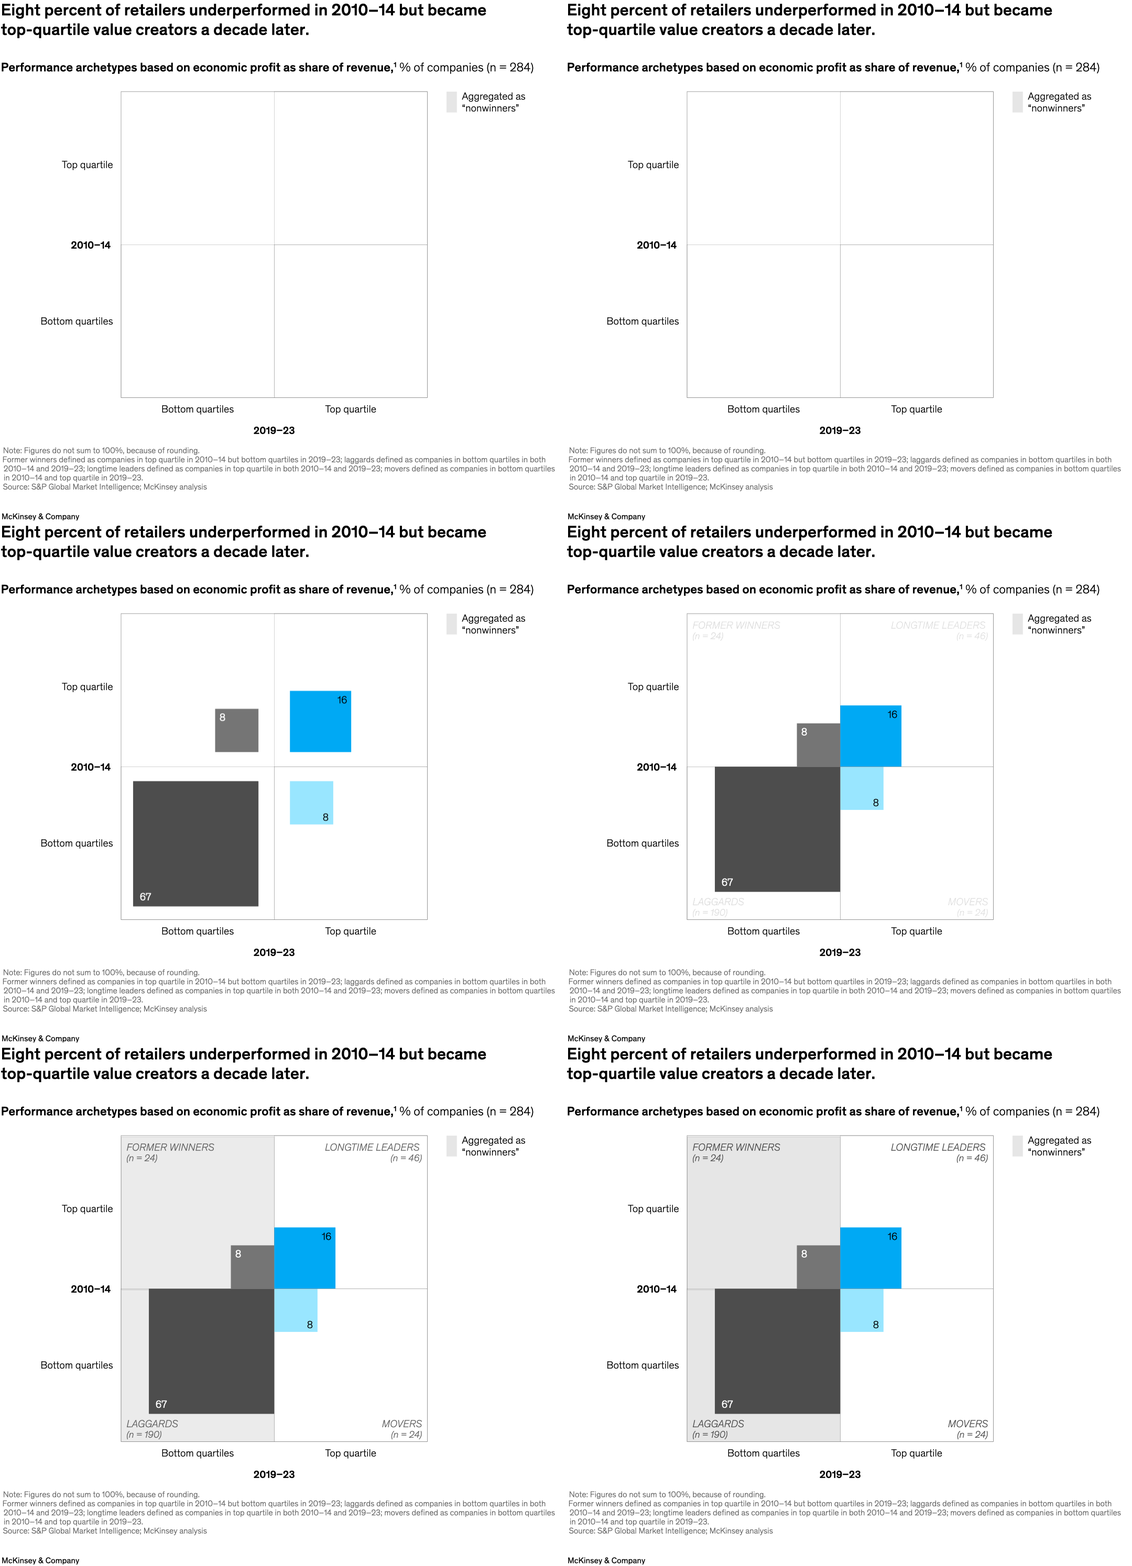
While large companies tend to have the upper hand in retail performance, size doesn’t always matter. Analysis of economic profit relative to revenue measures success independent of size, say senior partner Becca Coggins and colleagues. Through this lens, just 16 percent of retailers have been longtime leaders in value creation. But 8 percent of companies that were “laggards” from 2010 to 2014 managed to become top-quartile value creators in the following decade. These “movers” were significantly more likely than “nonwinners” to improve their performance in at least two of these dimensions: operating margin—specifically, cost of goods sold and SG&A ratios—growth, and capital efficiency.

Image description:
A 4-quadrant matrix illustrates the performance archetypes of 284 retail companies over two distinct periods: 2010–14 and 2019–23. The quadrants are defined by whether companies ranked in the top quartile or bottom quartiles in terms of economic profit as a share of revenue during each period. Companies fall into 1 of 4 archetypes:
- Top quartile in both periods: Labeled “longtime leaders,” this quadrant represents companies that consistently ranked in the top quartile for economic profit in both 2010–14 and 2019–23. It accounts for 16% of the 284 companies analyzed.
- Top quartile in 2010–14; bottom quartiles in 2019–23: This quadrant, labeled “former winners,” represents companies that experienced a decline in performance, dropping from the top quartile to the bottom quartiles over the decade. It accounts for 8% of the companies.
- Bottom quartiles in 2010–14; top quartile in 2019–23: This quadrant, labeled “movers,” represents companies that significantly improved their performance, moving from the bottom quartiles to the top quartile over the decade. It comprises 8% of the total companies.
- Bottom quartiles in both periods: This quadrant, labeled “laggards,” comprises companies that consistently underperformed, remaining in the bottom quartiles for both periods. This group represents the largest share of companies analyzed, accounting for 67% of the total.
Source: S&P Global Market Intelligence; McKinsey analysis.
End of image description.
To read the article, see “Retail's outperformers: Lessons in value creation,” September 3, 2024.